There is a question I keep coming back to, and it sits underneath almost everything we build at KXCO. Not what can a machine calculate, and not how much data can we store. The question is simpler and much harder: can a person actually understand what is in front of them, and understand it in time to act.
For most of the history of computing, the constraint was the machine. Data was expensive to gather, expensive to keep and slow to process. We spent decades making all three of those things cheaper, and we succeeded so completely that the constraint has now moved. Artificial intelligence produces more information every day than the whole of humanity produced in a year not long ago. Quantum computers, still early, can already move through certain problems at a rate that makes the old limits look quaint. The machine is no longer the slow part. The slow part is us.
This piece is a long argument for a short idea. The scarce resource in the modern economy is not data, and it is not compute. It is understanding. And understanding, for human beings, is visual before it is verbal. We reason best when information is laid out as a structure we can see, where the relationships between things are shown rather than described. The name for that structure, done properly, is an ontology. It is why KXCO puts one at the centre of the platform rather than off to the side, and it is why I believe ontology is the most important and most underrated idea in finance, banking and regulation today.
The thesis in one line
AI can give us an ocean of data. Quantum can process it at a rate we could not have imagined. But the way a human being will actually relate to it is by seeing it. Ontology is how KXCO turns the ocean into a picture, and the picture is where understanding happens.
How this is laid out. Sections 01 to 03 are the shape of the problem: too much data, fast processing, and a human being at the end of the chain who has to make sense of it. Sections 04 and 05 are the reason the answer is visual, grounded in the cognitive science rather than in slogans. Section 06 is what an ontology is, plainly. Sections 07 and 08 are the part I care most about, why this matters in finance, banking and regulation, where getting it wrong has cost the world trillions. Sections 09 to 11 are what KXCO has actually built, from the live public engine you can open right now to the way the same idea threads through every product we ship. This is the technical companion to my essay on Live Trading News; here I want to show the method as well as make the case.
Artificial intelligence made data infinite
Start with the raw fact that reframes everything. The total amount of data created, captured and replicated in the world reached roughly 181 zettabytes in 2025, on the widely cited estimates from IDC, up from a small fraction of that only a few years earlier.5 A zettabyte is a trillion gigabytes. Written out, the number is meaningless, which is rather the point. No human being has any intuition for it, because no human being was ever meant to hold it.
This is worth sitting with, because it inverts an assumption that most technology strategy still rests on. For thirty years the implicit promise was that if we could just capture more data, insight would follow. Gather everything, and the answers will be in there somewhere. That promise made sense when data was scarce. It is actively harmful now that data is infinite, because more of it does not bring you closer to understanding. It buries you further from it. The organisation drowning in dashboards is not short of data. It is short of a way to see what the data means.
The organisation drowning in dashboards is not short of data. It is short of a way to see what the data means.
I want to be precise about the nature of the problem, because it is easy to reach for the wrong solution. The problem is not volume in the storage sense. Storage is cheap and getting cheaper. The problem is comprehension bandwidth. A person has a fixed and rather small capacity to hold ideas in mind at once, and no amount of extra data changes that capacity. You can put a billion rows in front of someone; they will read a screen of them, form a rough impression, and move on. The data that is never looked at might as well not exist, and in a world of 181 zettabytes, almost all of it is never looked at.
Quantum moved the bottleneck, it did not remove it
If AI is the reason there is so much data, quantum computing is the reason we can increasingly do something with it. I want to be careful and honest here, because quantum is the most over-hyped word in technology and I have no interest in adding to the noise. Quantum computers are not magic, and they are not general-purpose replacements for the machines we use today. What they are is extraordinarily fast at a specific and important class of problems: search, optimisation, simulation, and certain kinds of pattern-finding across vast combinatorial spaces. Those happen to be exactly the problems that sit underneath making sense of a complex web of relationships.
The demonstration that made the point vivid came in December 2024, when Google announced its Willow chip. Willow ran a benchmark calculation in about five minutes that the company estimated would take one of the fastest classical supercomputers on the order of ten septillion years to finish, a length of time so far beyond the age of the universe that the comparison stops meaning anything.6 The specific benchmark is a narrow one, and reasonable people argue about how much it tells us about practical workloads. But the direction is not in doubt. For the right kind of problem, the processing constraint that defined the last era of computing is dissolving.
Here is why that matters for my argument. If you accept that AI has made data effectively infinite, and you accept that quantum is making the processing of certain hard problems effectively instant, then you have removed two of the three classical bottlenecks. Data: solved, painfully. Processing: solving, fast. What is left standing, untouched by any of it, is the third bottleneck. A person still has to look at the result and understand it. No chip changes that. A quantum computer can find the pattern in a septillionth of the time, and it will still be useless to a bank, a regulator or an investor unless a human being can see the pattern, trust it, and decide what to do.
The three bottlenecks
Data was the old constraint. AI removed it and then some. There is now more than we can use.
Processing was the next constraint. Classical computing shrank it and quantum is finishing the job for hard, structured problems.
Understanding is the constraint that remains, and it is the one nobody can engineer away with more silicon, because it lives in a human head. This is the constraint KXCO is built to relieve.
So the machine has, in effect, handed us a gift and a problem in the same motion. The gift is that we can now know almost anything about a system, in close to real time. The problem is that knowing and understanding are not the same thing, and the distance between them has never been greater. Closing that distance is not a hardware task. It is a representation task. It is about the form in which the answer is delivered to the person who has to use it.
The last mile is always a person
Every serious system, no matter how automated, ends at a human decision. A trader decides to put on the position. A credit committee decides to extend the loan. A supervisor decides whether a bank is safe. A board decides whether to approve the deal. We can push more and more of the work up the chain to machines, and we should, but the act that carries responsibility, and legal and moral weight, is still performed by a person. That is not a temporary state of affairs that better AI will remove. In finance and regulation especially, it is a feature. Someone has to be accountable, and accountability requires understanding. You cannot be responsible for a decision you did not comprehend.
This is where most of the industry quietly gives up. The standard answer to too much data is to compress it into a summary, a score, a red or green light, a number between zero and one hundred. Summaries are useful, but they hide the thing that matters most, which is why. A risk score of eighty tells you the model is worried. It does not tell you that the worry comes from a single counterparty that also sits behind four of your other positions, which is the fact that would actually change your decision. Compression throws away structure, and structure is exactly what a human needs in order to understand rather than merely to be told.
You can hold the entire truth of a situation in a spreadsheet and still never see it. The facts are all present. The pattern is absent.
What a person needs at the end of the chain is neither a summary that hides the why nor a table that hides the connections. What they need is a picture of the structure: the things, the relationships between them, and the ability to move from the whole down to any single fact and back again without losing their place. That is a very specific requirement, and it happens to be the exact thing an ontology, drawn as a graph, is built to deliver. But before I make that claim I want to ground it, because the reason a picture works is not aesthetic. It is neurological.
Why imagery comes first
I hold a strong view about how understanding actually works, and I will state it as plainly as I can, because it is the belief that shapes the whole design of KXCO.
Imagery is the primary form of understanding. All language, written or spoken, is subtext.Dr. Shayne Heffernan
I do not mean this as a flourish. I mean it close to literally. When you truly understand something, you can see it. You have a mental picture, a shape, a model in the mind's eye, and the words you use to describe it come afterwards, as a way of pointing at the picture you already hold. Language is how we transmit understanding to one another, and it is a magnificent tool, but it is a serial, slow, lossy channel laid over the top of something faster and older. The understanding itself is spatial. Ask any mathematician, any engineer, any chess player, any great investor how they think, and underneath the vocabulary you will almost always find a picture.
The cognitive science has been pointing this way for half a century, and it is worth walking through the strongest parts of it, because I would rather build on evidence than on assertion.
The brain reads pictures faster than anything else
In 2014, Mary Potter and colleagues at MIT published a study with a startling result. They flashed sequences of images at people at speeds down to thirteen milliseconds per picture, faster than the eye can consciously fixate, and found that people could still identify the meaning of a target image, for instance a picnic or a smiling couple, at that speed.4 Thirteen milliseconds is roughly a hundredth of a blink. The brain was extracting meaning from an image in less time than it takes to become consciously aware of seeing it. There is no comparable feat for text. You cannot read a sentence in thirteen milliseconds. The visual system is not just one channel among several; it is the fast path to comprehension, running far ahead of the verbal one.
This is not an accident of wiring. It reflects how the brain is built. Vision is the single largest consumer of cortical resources we have. Neuroscientists commonly estimate that on the order of a third of the cerebral cortex is involved in visual processing, dwarfing the shares given to hearing or touch.9 We are, physically, visual animals first. When you show a person a picture, you are speaking to the largest and fastest part of their apparatus for understanding. When you hand them a page of text or a table of numbers, you are routing everything through a narrow and comparatively recent channel and asking the visual system to sit the round out.
We remember and reason with pictures better too
Two further bodies of work reinforce the point. The first is the picture superiority effect, a much-replicated finding that people remember information presented as images far better than the same information presented as words. The second is Allan Paivio's dual-coding theory, which explains why: the mind encodes visual and verbal information in two connected systems, and a picture recruits both, giving it two routes to memory and understanding where a word has one.7 Information you can see is information you can hold, recall and manipulate. Information you can only read decays faster and costs more to keep in mind.
The most important study for my purposes, though, is the oldest, and it is about reasoning rather than memory. In 1987, Jill Larkin and the Nobel laureate Herbert Simon published a paper with a title that says almost everything: Why a Diagram is (Sometimes) Worth Ten Thousand Words.3 Their argument was rigorous rather than rhetorical. They showed that a diagram and a written description can contain exactly the same information and still not be equally useful, because the diagram groups related pieces of information by their location in space. When the facts you need to reason about are placed next to each other, you do not have to search for them or hold them all in memory at once. The diagram does part of the thinking for you by putting the right things in the right place. The text, however complete, forces you to do all of that work in your head.
That last point connects to one more classic result. In 1956, George Miller published his famous paper on the limits of working memory, the origin of the idea that a person can hold only around seven items in mind at once.8 The exact number matters less than the shape of the limit: our capacity to juggle separate facts is tiny and fixed. A diagram is powerful precisely because it lets us escape that limit. Instead of holding a hundred facts in a seven-slot memory, we hold one picture and read the facts off it as needed. The picture becomes external memory, and reasoning that was impossible in the head becomes easy on the page.
Put these findings together and a clear conclusion emerges. Human understanding is fastest, most durable and most powerful when information is presented visually, as a structure whose relationships are shown in space. This is not a matter of taste or of some people being visual learners and others not, a popular idea that the evidence does not actually support. It is a matter of how the species is built. If your goal is genuinely for a person to understand something complex, and to act on that understanding under pressure and with responsibility, then delivering it as a picture is not a nice touch. It is the requirement. Everything else is subtext.
A list is not a map
Let me make all of this concrete, because the gap between a list and a map is the whole argument in miniature.
Consider a handful of ordinary facts about the AI economy, the kind you could read in any business paper. Nvidia invests in OpenAI. OpenAI buys enormous quantities of compute from Oracle. Oracle buys its chips from Nvidia. Nvidia also invests in Anthropic. Anthropic buys its compute from Microsoft. Microsoft buys its chips from Nvidia. Written as a list, each fact is clear, each is true, and the list is complete. Read it and you learn a set of individual relationships. What you almost certainly do not see, because the format hides it, is that the money is moving in a circle. Capital flows out from the chipmaker into its customers, and a large part of it flows straight back in the form of chip purchases. The list contains that loop. It does not show it.
Now draw the same facts as a map, with each company a point and each relationship a line, and the loop is not just visible, it is impossible to miss. Your eye finds the closed circle before you have consciously read a single label, because closed shapes are exactly the kind of thing the visual system is tuned to detect instantly. The fact that took a paragraph of careful reading to suspect is now apprehended in a fraction of a second. Nothing was added. The information is identical. Only the form changed, and the change in form is the difference between data you possess and insight you have.
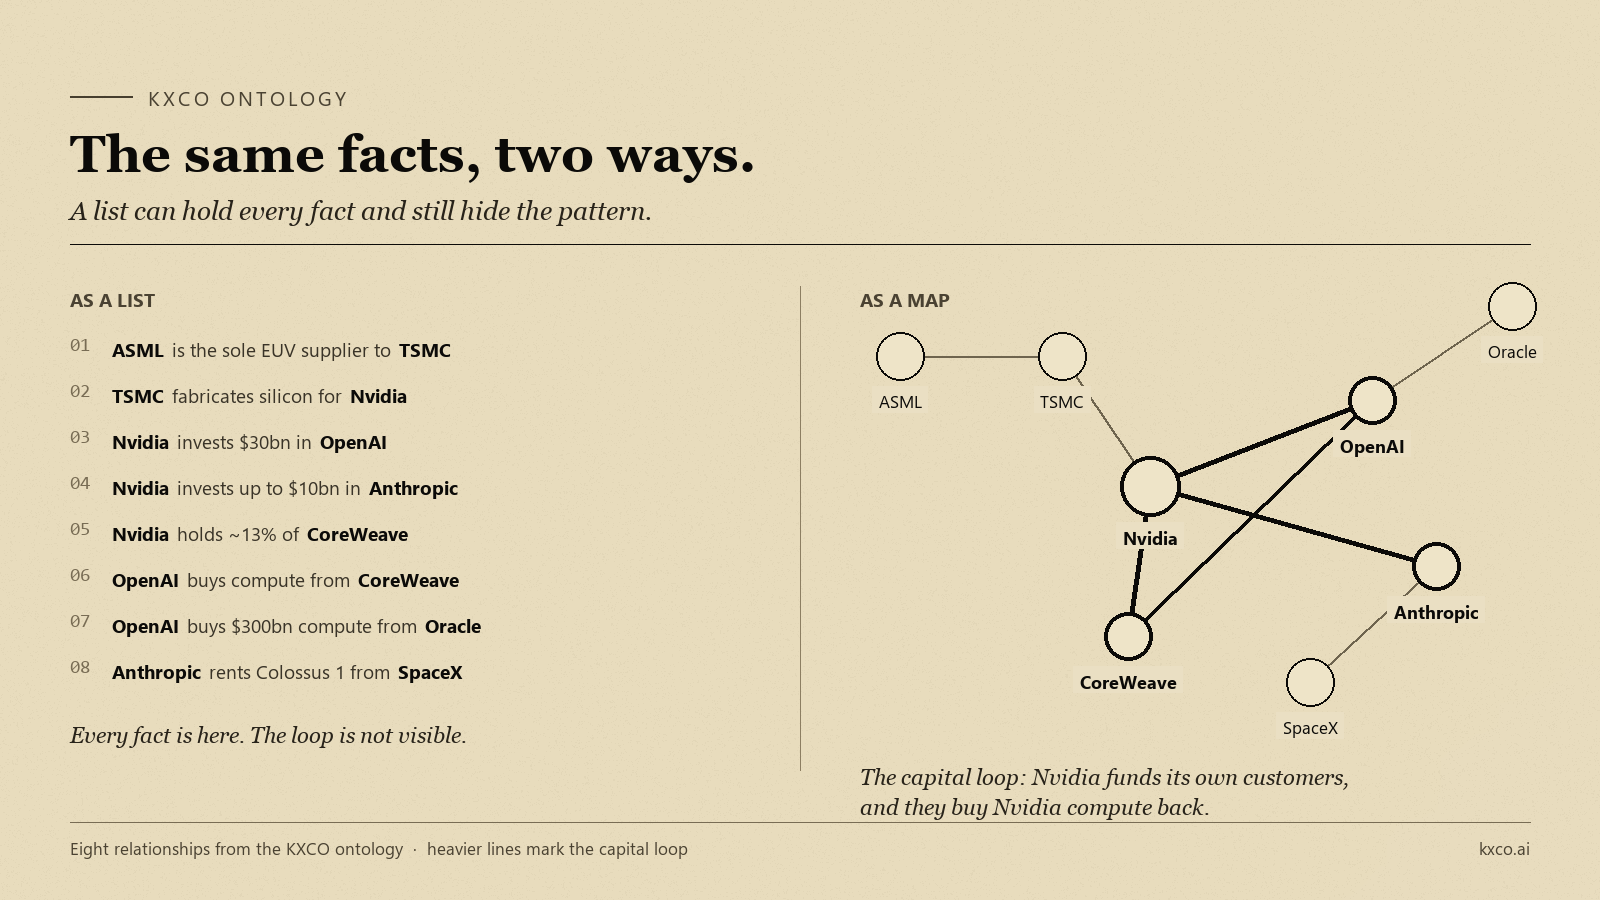
This is what Larkin and Simon meant, made physical. The map does part of your thinking for you by placing related facts next to each other and letting the shape carry the meaning. And it generalises far beyond a toy example about chip companies. Every important system that human beings need to understand and cannot easily see is a system of relationships: a supply chain, a corporate ownership structure, a web of financial exposures, a network of transactions, the flow of a legal obligation from one party to another. In every one of these, the facts are usually available and the pattern is usually hidden, for the simple reason that we store them as lists and rows rather than as maps. The information is not missing. The picture is.
KXCO exists, at its foundation, to supply the missing picture. Not as decoration on top of a report, but as the primary representation, the thing the person looks at first and reasons with directly. To do that reliably, at scale, and in a way a machine can also reason over, you need more than a drawing. You need the drawing to be backed by a rigorous underlying model. That model is the ontology.
What an ontology actually is
The word sounds academic, and it comes from philosophy, where ontology is the study of what exists and how things relate. In information science it means something concrete and useful. An ontology is a formal model of a domain that describes the types of things in it, the types of relationships that can hold between them, and then the actual instances: this specific company, that specific person, this particular obligation between them.
The difference that matters from an ordinary database is what gets treated as a first-class citizen. In a database, the rows are the important thing and the relationships are implied, buried in shared keys and join tables that only a query can reassemble. In an ontology, the relationship is the unit of knowledge. Every fact is stored as a small, complete statement of the form subject, relationship, object. Nvidia (subject) invests in (relationship) OpenAI (object). Because relationships are explicit and first-class, the whole thing is a graph by nature, and a graph is a picture waiting to be drawn.
At KXCO we add a discipline to this that I consider non-negotiable, and it is the part that makes an ontology trustworthy rather than merely tidy. Every claim in our model carries its provenance. It is not enough to assert that Nvidia invests in OpenAI. The claim has to travel with three things attached: a source, so you can see where the assertion came from; an as-of date, because a fact true last quarter may be false today; and a confidence level, because some things are documented in a filing and others are reported second-hand, and an honest model does not pretend those are the same. Where a fact is genuinely unknown, the model says so explicitly rather than guessing or leaving a misleading blank.
A value is a typed claim, not a bare number. "Nvidia into OpenAI, one hundred billion dollars" means nothing until it carries its source, its date, and how sure we are.
This is what turns a pretty graph into infrastructure you can build a bank on. When every relationship in the picture is a typed, sourced, dated, confidence-scored claim, the picture is no longer an artist's impression. It is an auditable model of reality. You can click any line and see exactly why it is there and how much to trust it. You can ask the model questions and get answers that come with their evidence attached. And because the whole thing is machine-readable as well as human-readable, an AI agent can reason over the very same structure a person is looking at, which means the human and the machine are finally working from one shared, inspectable picture of the world rather than two divergent ones. I have written about that agent-facing side of the argument separately, in Ontology is the missing layer in agentic AI, and about how the ontology composes with the rest of the stack in Chain, Quantum, Ontology, AI. Here I want to stay with the human side, and in particular with the field where getting this right matters most.
Ontology in finance and banking
I have spent my career in and around markets, and I can tell you that finance is not, at bottom, a business of numbers. It is a business of relationships, and the numbers are just the current readings on those relationships. Who owns what. Who owes whom, and by when. Which exposures move together and which move apart. Which counterparty sits quietly behind three others you thought were independent. Every one of these is a relationship, and the entire discipline of risk management is really the discipline of understanding a web of them well enough to survive when it moves.
This is exactly the kind of understanding that lists and tables destroy and that maps preserve. A bank's risk system can hold every position, every counterparty and every exposure in a database and still be blind to the one structural fact that matters, because that fact is not in any single row. It is in the shape of the connections between rows. The most expensive lessons in modern financial history have been, over and over, failures to see structure that was fully present in the data all along.
2008 was a failure to see relationships
The global financial crisis is the case that should be taught in every data class, not just every finance class. The information needed to understand the danger was, to a very large extent, already recorded somewhere. Institutions held the mortgages, the securities built on them, the derivatives built on those, and the web of counterparty exposures that tied everyone together. What almost nobody had was a picture of how it all connected. Firms could not see their own aggregate exposure to a failing counterparty across all their desks and subsidiaries, let alone their exposure to the counterparties of their counterparties. When one large institution wobbled, no one could tell in time who else would fall, because the relationships were scattered across thousands of systems as disconnected rows. The facts were present. The map was absent. The absence of the map cost the world somewhere in the trillions.
The regulatory response to that failure is, when you look at it closely, an attempt to force finance to build the map. In 2013 the Basel Committee published a set of principles known as BCBS 239, on effective risk data aggregation and risk reporting.10 Strip away the language and what BCBS 239 demands is that a large bank be able to pull its risk data together across every silo, quickly, accurately and completely, so that senior people can actually see the institution's total risk as a single coherent view. That is a request for an ontology in all but name. It is a demand that the bank stop storing its reality as disconnected lists and start being able to render it as one connected, aggregatable, comprehensible whole. More than a decade on, many institutions still struggle with it, precisely because they are trying to satisfy a demand for a map using technology built for rows.
The plumbing is finally becoming structured
There is a quieter revolution that makes all of this newly possible, and it is worth knowing about because it is the enabling condition for everything KXCO does in this space. The world's payment and messaging infrastructure is migrating to a standard called ISO 20022, a structured, meaning-rich format for financial messages that is replacing the terse, ambiguous formats banks have used for decades.11 The significance is that money is starting to move with proper, machine-readable context attached: who, to whom, for what, under which obligation. Structured messages are the raw material an ontology feeds on. As the plumbing becomes semantic, the opportunity to build a live, connected, comprehensible model of financial reality goes from theoretically appealing to practically achievable. KXCO has designed for this world deliberately, mapping our model to these institutional standards so that we speak the language regulated finance is converging on rather than a proprietary dialect of our own.
Ownership, laundering and the things built to hide
There is a whole category of financial risk that exists specifically to defeat the list-and-table view of the world, and it is where an ontology earns its keep most dramatically. Money laundering, sanctions evasion and the concealment of beneficial ownership all work by exploiting the fact that institutions store reality as disconnected records. A network built to move illicit money is designed so that no single account, no single filing and no single jurisdiction shows anything wrong. The wrongness lives entirely in the relationships between them: an account here, controlled by a company there, owned through a trust in a third place, transacting in a pattern that only makes sense when you can see the whole shape at once. Ask an anti-money-laundering team what they are really fighting and it is this. They are trying to see a structure that someone has spent real effort and real money making invisible.
An ontology is close to the ideal instrument for that fight, because it makes the structure the primary object rather than an afterthought you reconstruct by hand. A shell company that looks innocent as a row becomes obvious as a hub with too many faint connections. A beneficial owner hidden behind three layers of holding companies becomes a node you can trace to with your eye, following the ownership edges up until you reach the person. A circular transaction pattern that no single statement reveals becomes a loop on the map, exactly like the loop of capital in the picture earlier. The know-your-customer and anti-money-laundering obligations that every regulated institution carries are, in the end, obligations to understand a web of relationships. Handing an analyst a searchable map of that web instead of a stack of filings is not a marginal improvement. It is the difference between looking for a needle in a haystack and being shown the needle.
The practical payoff of an ontology in a financial institution is not abstract. It is the difference between the following two experiences. In the first, a risk officer asks a question, waits days for three teams to reconcile four systems, and receives a spreadsheet that answers a slightly different question than the one asked. In the second, the officer opens a live map of the institution's exposures, sees at a glance that a cluster of positions all trace back to a single stressed counterparty, clicks the line to see the source and the confidence, and makes the call in minutes with the evidence in front of them. The first is where most of the industry still lives. The second is what becomes possible when you treat the relationships as the primary thing and render them as a picture a human can read. KXCO builds the second.
Ontology and the regulator
If ontology matters to a bank, it matters even more to the people who supervise banks, and this is the part of the argument I feel most strongly about. A regulator's entire job is to understand a system too large and too interconnected for any individual to hold in their head, and to understand it well enough to spot danger before it becomes a crisis. That is, almost word for word, the problem this whole essay is about. Supervision is understanding at scale, under time pressure, with enormous consequences for getting it wrong.
A rule is only as good as the regulator's ability to see the thing it applies to. You cannot supervise what you cannot picture.
This is why I argue that ontology is a regulatory technology as much as a financial one, and potentially the most important development in supervision since the move to electronic reporting. An ontology gives a supervisor the one thing the current toolkit denies them: a live, connected, inspectable picture of the system they are responsible for. Concentration risk that is invisible across a thousand separate filings becomes a bright cluster on a map. A contagion path that would take a team weeks to trace by hand becomes a line you can follow with your eye. A beneficial-ownership structure deliberately built to be confusing becomes a shape you can see through. And because every claim on the map carries its source and its confidence, the supervisor is not asked to take any of it on faith. They can drill from the pattern down to the single filing that supports it, and back up again, without ever losing the whole.
There is a deeper point about the nature of rules here. A regulation is a statement about relationships that must or must not exist: this entity may not be exposed to that one beyond a limit, this activity may not be funded in that way, this owner must be disclosed. Enforcing such a rule requires, first and above all, the ability to see the relationship the rule is about. A rule the regulator cannot picture is a rule the regulator cannot enforce, no matter how well it is written. This is why I say that ontology sits underneath the whole project of financial regulation. It is the layer that makes rules legible in reality rather than only on paper. As the volume of activity explodes under AI, and as automated agents begin to transact at machine speed, the gap between what regulators are responsible for and what they can actually see will become the defining risk in the system. Ontology, rendered as a picture a supervisor can read in real time, is the only serious answer I know of to that gap.
None of this requires KXCO to be a regulated institution, and we are not one. We are a software company. What we provide is the infrastructure, the semantic layer and the visual engine, that lets the institutions and, in time, the supervisors who do carry those responsibilities finally see the systems they are accountable for. The map is ours to build. The decisions it informs remain firmly with the people the law makes responsible for them.
The KXCO Ontology Engine
I dislike arguments that stay abstract, so we built the argument into something you can open right now. The KXCO Ontology Engine is a live, public model of the artificial intelligence economy, and it is the visible proof of everything this essay claims. It maps roughly a hundred entities, the chipmakers, cloud providers, model labs, investors and the people who run them, together with the capital, supply and control relationships that connect them, and it renders the whole thing as a map you can explore, filter and interrogate.
We chose the AI economy as the public demonstration for a reason. It is the most consequential and least understood web of relationships in the world today, full of exactly the kind of hidden structure this essay is about. Open the engine and ask it the questions built into it. Who depends on whom. Which company invests in its own customers. How much capital moves in a circle. Follow the supply chain down and watch it narrow, through the chipmakers, to the handful of companies, and ultimately the single Dutch firm, that the entire edifice rests on. Every answer is a typed claim you can click to inspect: a subject, a relationship, an object, each carrying its source, its date and its confidence. Where a fact is undisclosed, the engine tells you it is undisclosed rather than inventing a number. That is the standard I want all analysis held to, and it is the standard we hold ourselves to in public, where anyone can check our work.
The engine also carries an AI layer, so you can ask it questions in plain language and have it reason over the same structured model you are looking at, returning answers grounded in the map rather than in the open-ended guesswork of a chatbot with no facts behind it. This is the human and the machine working from one shared picture, which is the whole point. It is a small preview of a much larger idea: that the right way for people and AI to collaborate is over a common, inspectable model of reality, not across the gap between a person's intuition and a black box.
What you see in the public engine is the same method we apply privately for institutions, pointed at whatever domain they need to understand: their own exposures, their supply chain, their ownership structures, their market. The public map is about AI companies because that is the story of the moment. The private maps are about whatever keeps a particular institution's leadership awake at night. The engine is the same underneath.
How the ontology runs through everything KXCO builds
People sometimes ask why a company with a document-signing product, a treasury product, a security product and a blockchain also talks so much about ontology, as if it were a separate hobby. It is the opposite of separate. The ontology is the spine. Each product is a different organ hanging off the same nervous system, and the nervous system is the shared, connected, inspectable model of who and what is real and how it all relates. Let me trace it through the platform, because seeing how one idea threads through many products is itself an example of the argument.
- KXCO Guildhall is where identity, legal execution and proof live, bringing together verified identity, document signing and verification. Every one of those is a statement about relationships between parties: this person is who they claim to be, this party agreed to that obligation, this document is the authentic one. Guildhall writes those relationships into the ontology as typed claims, which is what lets a signature be more than an image. It becomes a node in a connected, provable structure of who agreed to what, and when.
- KXCO Portcullis, the quantum-resistant cloud and our security surface, protects the integrity of the whole model. There is no point in a beautiful, trustworthy map of reality if the map itself can be forged or quietly altered. Portcullis and our post-quantum cryptography exist so that the claims in the ontology cannot be tampered with, now or in the era of quantum attack. Understanding built on a model you cannot trust is worse than no understanding at all.
- Armature L1, our settlement layer and public record, is where the most important claims get anchored so that anyone can prove them, permanently, rather than take them on trust. The ontology says what is true and shows the picture; Armature makes selected parts of that truth tamper-evident and independently checkable. Meaning and proof, working together.
- Guildhall, where Members run their deals, is perhaps the clearest single illustration. A deal is a dense web of relationships between parties, terms, obligations and documents. Guildhall treats a deal as a structure in the ontology rather than a folder of files, so the people in it can see the shape of the whole thing rather than reconstruct it painfully from a data room. It is the list-versus-map argument applied to the way capital actually gets deployed.
Read across those and the pattern is the same one this whole essay is about. Five products, one idea. Each takes a domain that institutions currently experience as a pile of disconnected records and turns it into a connected, inspectable, visual model of reality. That is not five separate bets. It is one bet, made five times, that the scarce resource is understanding and that the way to supply it is to map the relationships and show the picture. For developers who want to build on this directly, the KXCO developer platform exposes the same primitives, from post-quantum identity and signing through to the on-chain record, so that an application can write into and reason over the same model.
AI gives us the data, quantum processes it, the eye understands it
Let me bring the three threads of this essay together, because the way they combine is, to me, the shape of the next decade.
Artificial intelligence is a machine for producing understanding-relevant material at unlimited scale. It reads everything, watches everything, transcribes everything, and turns the unstructured mess of the world into structured signals faster than any army of analysts ever could. It is the supply side of knowledge, and it is effectively infinite now.
Quantum computing, as it matures, is a machine for finding structure in that material at rates classical computers cannot match. The problems at the heart of understanding a complex web of relationships, searching an enormous space of possible connections, optimising over it, simulating how it behaves under stress, are exactly the problems quantum is suited to. It is the processing side, and it is arriving.
But neither of those touches the moment that actually matters, which is a human being looking at the result and understanding it. That moment is visual. It has always been visual. It will still be visual when AI is a hundred times more capable and quantum is a thousand times faster, because it happens in a brain that was reading pictures in thirteen milliseconds long before any of this existed and will be doing so long after. The eye is the part of the pipeline you cannot upgrade, and so it is the part everything else must serve.
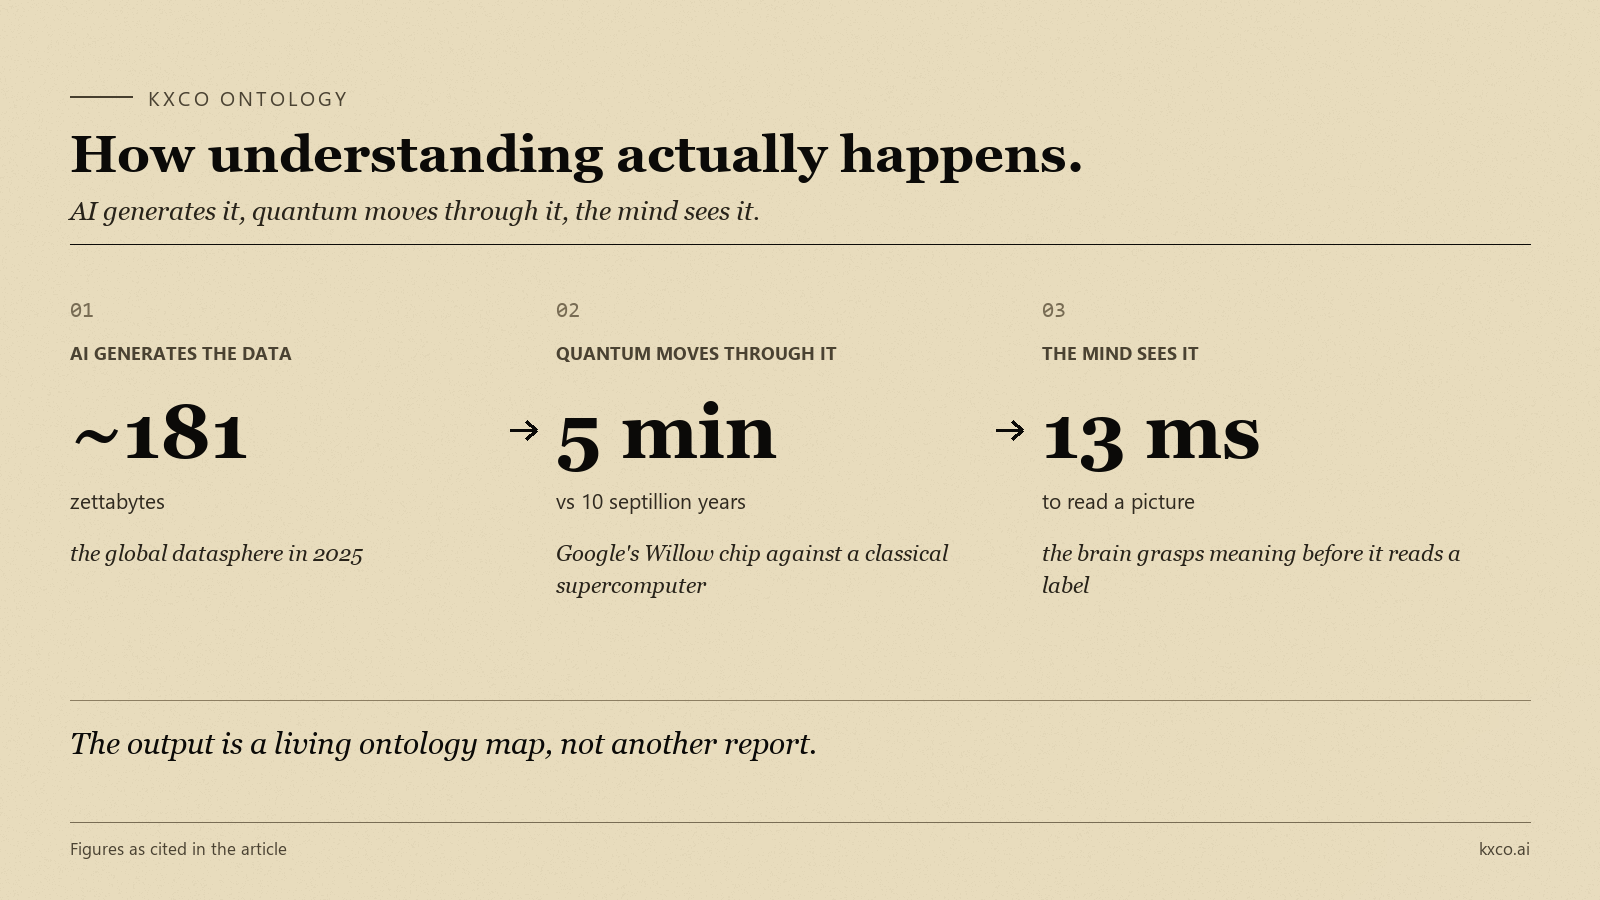
This is the design principle of KXCO stated at its most fundamental. We do not build for the machine, because the machine is not the bottleneck any more. We build for the person at the end of the chain, whose comprehension is the scarce resource everything else exists to serve. AI fills the model with signal. Quantum-grade processing and our cryptography keep it fast and trustworthy. The ontology organises it into relationships. And then, at the last step, the one that all the others are for, we render it as a picture a human being can understand at a glance, question with a click, and act on with confidence. Imagery is the primary form of understanding. Everything upstream of the picture is subtext, extraordinary and necessary subtext, but subtext all the same.
What we claim, and what we don't
In the spirit of the ontology, let me be explicit about the edges of this argument, because overreach is how good ideas get discredited.
- We claim that data has become effectively infinite, that processing is ceasing to be the binding constraint for structured problems, and that human understanding is therefore the scarce resource, and that understanding is fundamentally visual. Each of these rests on the sources cited here, not on assertion.
- We do not claim that quantum computers are general-purpose or that they are ready to run a bank today. They are early, and they excel at a specific class of problems. The framing that quantum can process data at a remarkable rate is true for those problems and should not be stretched into a claim that it can do everything.
- We do not claim that visualization is magic or that a pretty graph is the same as a rigorous one. The value of an ontology comes entirely from the discipline underneath the picture: typed claims, real sources, honest dates, explicit confidence, and undisclosed marked as undisclosed. A graph without that discipline is worse than a table, because it looks authoritative while being unaccountable.
- KXCO is software. We build the semantic layer, the model and the visual engine. We are not a bank, a custodian or a regulated institution, and nothing here is investment or regulatory advice. The responsibilities that finance and supervision carry remain with the licensed institutions and authorities that hold them. Our job is to help them see.
Frequently asked questions
What is an ontology, in one sentence?
A formal map of the things in a domain and the relationships between them, where every fact is a typed claim carrying a source, a date and a confidence, which means it can be drawn as a picture a person understands at a glance and a machine can reason over at the same time.
Why does KXCO put ontology at the centre rather than treat it as a feature?
Because the constraint that matters has moved from data and processing, which AI and quantum are relieving, to human understanding, which nothing else relieves. Ontology is how we turn infinite machine-generated data into a structure a person can see and act on. It is the spine the whole platform hangs off, not an add-on.
Why is this especially important in finance, banking and regulation?
Because finance is made of relationships, and its most expensive failures, above all the 2008 crisis, were failures to see relationships that were present in the data all along. Regulation since then, from BCBS 239 to the ISO 20022 migration, is an attempt to make financial reality aggregate into a picture supervisors can read. An ontology is precisely that picture, done rigorously.
How is this different from a dashboard or a BI tool?
Dashboards summarise and charts plot variables, but both usually hide the relationships between entities, which is where the meaning lives. An ontology makes the relationship the primary object, so it can reveal structural patterns, such as a loop of capital or a hidden concentration, that no summary or bar chart will ever show.
Can I see it working?
Yes. The KXCO Ontology Engine is a map of the AI economy on public data, where every claim is sourced and inspectable. It is the visible proof of the method. Since 16 October 2026 it opens by password, and anyone can request access at its door.
Where does the quote about imagery come from?
It is my own view, stated in this essay: imagery is the primary form of understanding, and all language, written or spoken, is subtext. It is the belief that shapes how KXCO designs everything, from the ontology model down to the way a single claim is drawn.
References & further reading
- Shayne Heffernan, essays on ontology, markets and trust infrastructure, Live Trading News author page (the general-audience companion writing to this piece).
- KXCO Ontology Engine, kxco.ai/ontology-live (the live, interactive map of the AI economy).
- Jill H. Larkin & Herbert A. Simon, "Why a Diagram is (Sometimes) Worth Ten Thousand Words," Cognitive Science 11, 65 to 99 (1987), Wiley.
- Mary C. Potter, Brad Wyble, Carl Erick Hagmann & Emily S. McCourt, "Detecting meaning in RSVP at 13 ms per picture," Attention, Perception, & Psychophysics 76, 270 to 279 (2014), Springer.
- IDC, Global DataSphere forecast (world data reaching roughly 175 to 181 zettabytes by 2025), idc.com.
- Google, "Meet Willow, our state-of-the-art quantum chip" (December 2024), blog.google.
- Allan Paivio, dual-coding theory, and the picture superiority effect (Paivio & Csapo, 1973; Nelson, Reed & Walling, 1976), overview at Dual-coding theory and Picture superiority effect.
- George A. Miller, "The Magical Number Seven, Plus or Minus Two," Psychological Review 63, 81 to 97 (1956).
- On the share of the cerebral cortex involved in vision (commonly estimated at around a third), overview of the visual system at Wikipedia; see also Colin Ware, Information Visualization: Perception for Design.
- Basel Committee on Banking Supervision, "Principles for effective risk data aggregation and risk reporting" (BCBS 239, 2013), bis.org.
- ISO 20022, the structured standard for financial messaging, iso20022.org.
- Companion essays, "Ontology is the missing layer in agentic AI" and "Chain, Quantum, Ontology, AI" KXCO Blog.
Figures reflect published estimates through 2026 and are modelled as typed, sourced claims on the live ontology, which carries confidence levels where sources differ. KXCO is a software company. Nothing here is investment or regulatory advice.